Debugging Tips
Debugging is a fairly essential part of programming, and this post aims to give you a few general tools and strategies to help you debug effectively.
Debugging Tools
Most IDEs and languages have various tools to help you with debugging. In this post I’m going to use JavaScript and a web browser as an example, but most of this applies in other places as well.
Print Statements
One of the simplest, but also most powerful, debugging tools is print statements. These have different syntax in different languages but the basic idea is the same. In JavaScript use console.log and view the output in the console portion of your browser’s developer tools
How to use print statements
- For discovering the value of a specific variable (ex.
console.log(val)); - For marking if a certain part of code, usually a function or if-else block, is reached (ex.
console.log("We made it inside foo()")) - To count the number of times a function or block of code runs (ex.
console.log("One time")and count how many times the line appears)
Disadvantages of print statements
- They require rebuilding or re-compiling your code
- You need to know what you are looking at ahead of time
Breakpoints
These are IDE, rather than language, dependent. I’ll show how to use them in a browser, and the basic strategy remains the across different IDEs. Searching something along the lines of “how to use breakpoints <your ide>” in Google should help you understand the semantics.
To use a breakpoint:
- Click the “Debugger” tab in the browser’s developer tools
Click the line number for the line you want to activate the breakpoint for. A blue tab will appear

Run the code that the breakpoint is set on (ex. reload the page, press a button, etc.). This will highlight the line the breakpoint is on once it reaches it

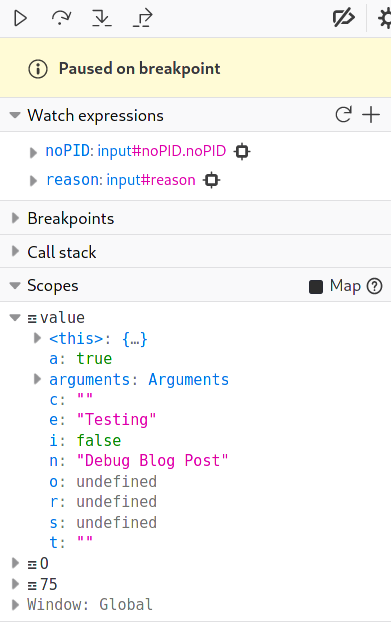
On the right hand side of the window will be multiple options for managing program state. Most IDEs will have similiar options, though they may be in different places

- At the top are the flow control buttons. From left to right:
- The play button continues program execution until the next breakpoint.
- The skip button moves one line forward
- The step into button enters the code on the current line, going into the the function on the current line
- The step out goes into the next level of scope outside of the current function
- Watch expressions allows you to evaluate a specific expression, mainly useful for seeing the value of specific variables. These can be changed before or after the breakpoint is reached
- At the top are the flow control buttons. From left to right:
Advantages of breakpoints
- To get a wholistic understanding of the program, since it is much easier to examine all variables
- To view program flow without having to predict the exact order you want to inspect
- To allow pausing without rebuilding your code
- You can set conditional breakpoints in many IDEs that only pause when a certain condition in the code is reached
Disadvantages of breakpoints
- They can require more setup than print statements
- Not all languages and environments support them
- It can be harder to predict how to use a breakpoint when asynchronous code is involved
Debugging Strategies
Know what you’re looking for
The most important part of debugging is knowing what to look for. A good way to fix design-related bugs is to make a design for your app, ideally before you even start coding. The App Lab blog post on Figma has an example of how to do that.
Explain the problem to someone
Explaining your code to someone (or something) else can help you solve it. It doesn’t need to be another programmer, a friend or cat will do fine, but the actual act of explaining the problem line for line can help you see where the bug is.
Figure out how to reproduce the problem
Make sure you know how to make the bug appear consistently. Usually this is simple, but it can be more complicated, espeically in asychoronous environments. Frequently the bug can be traced to a specific function. If this function is pure (meaning that it only depends on its parameters and not class or global state) you should probably just test the parameters that cause the issue on that function, rather than running it through the whole app.
Find the exact location of the error
Using the tools above narrow down where the bug is occurring in your code. Finding the exact line or function is generally key. Use the debugger or print statements to find where the output goes wrong and trace it back to the origin of the bug.
Make methodical changes
Make one change at a time and test it, particularly if you’re not confident how it will change the result. Otherwise you may not be sure what actually solved the bug.
When you’re stuck, ask for help
Sometimes you just need someone else’s input in order to solve a problem. After trying for at most a couple of hours, seek out some else’s help. You can drop by the AppLab or ask for help on the App Lab Slack.
