About the Mural
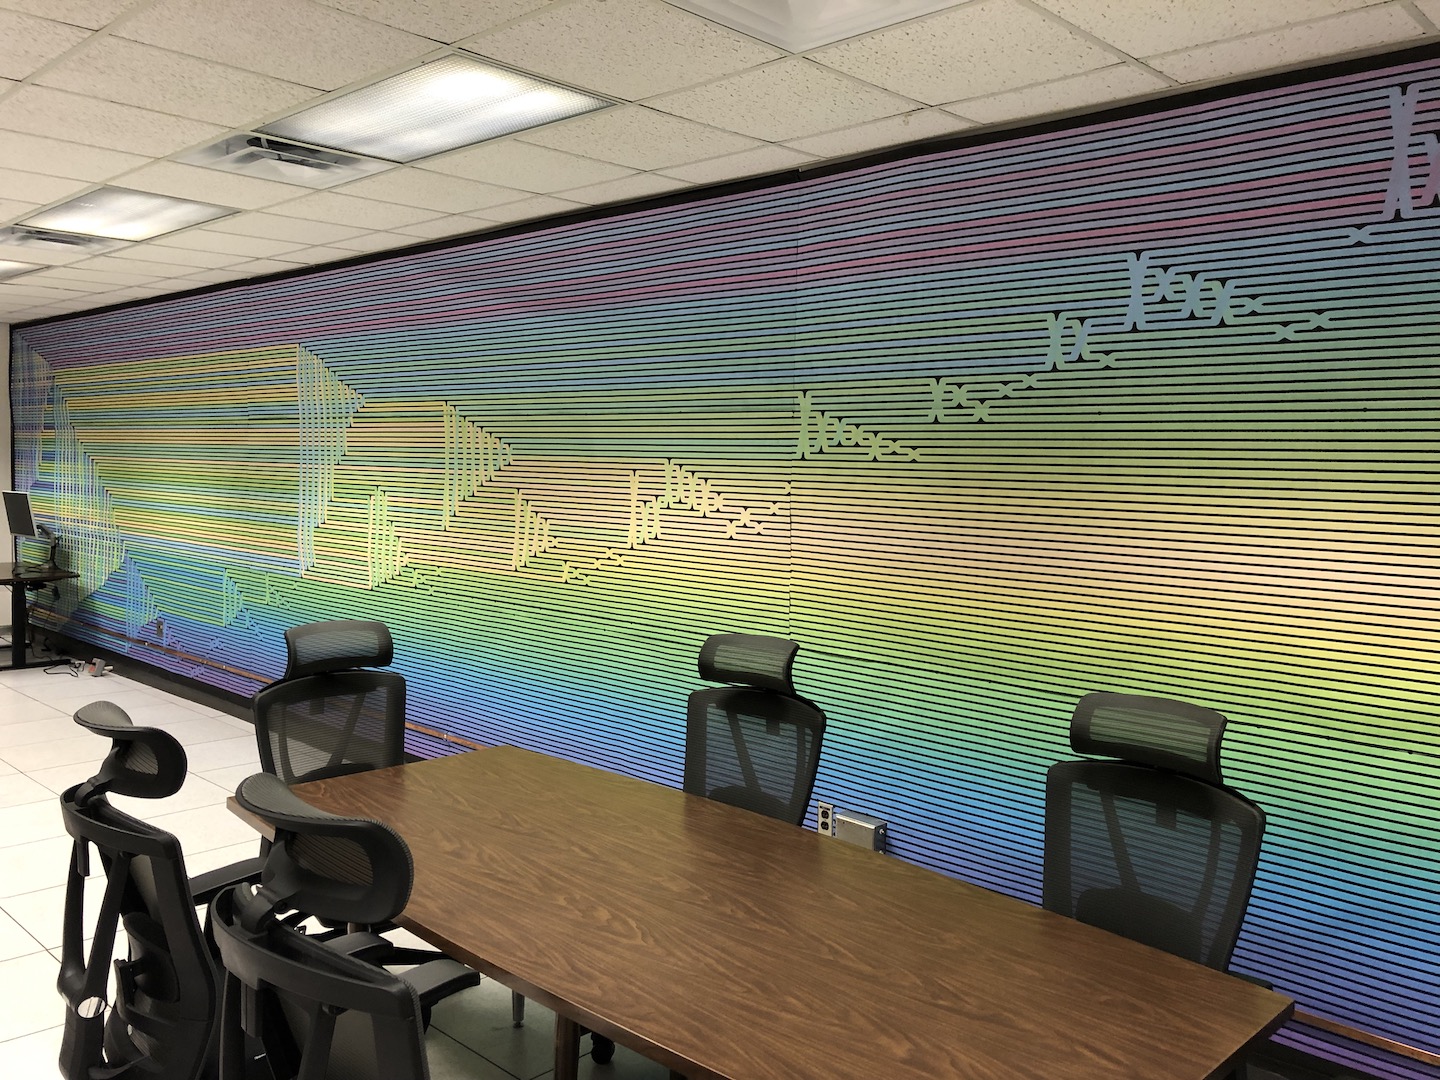
Last semester, I invited students (especially art students) to submit an idea for a mural, to make the App Lab feel a little more colorful. In the end, I was most impressed with Henderson Beck, who helped me get a mural completed and posted on the wall. This post tells that story and includes links to pictures, source code, and even a video of the mural.
I ended up asking Henderson to create an idea based on a visualization that had caught my eye years ago about halfway down this wonderful page on visualizing algorithms by Mike Bostock, the creator of d3.js. I managed to track down the source code for a similar visualization, and Henderson and I collaborated to pick a color scheme that could work better for wall art. We ended up with this image (source code Gist is here):
Importantly, thanks to d3.js, we generated a vector graphic rather than a raster graphic. Vector graphics (like SVG, Adobe Illustrator, or Adobe PDF) specify the instructions for drawing the lines, curves, and shapes, whereas raster graphics (like PNG, JPEG, and GIF) record color values at pixels. The important property here is that vector graphics can be enlarged as much as you want, because the fundamental drawing instructions are present, whereas enlarged raster graphics start to look blocky. Henderson greatly enlarged the SVG image that the d3.js code created, cut it into strips, and printed it using a wide-format “plotter” printer in Sitterson Hall. Then he tacked each strip to the wall.
Here’s the result, hanging on the App Lab wall:
Also, I recorded a video tour of the App Lab in which you can see the mural.
…but of course, for the full experience, you should stop by and check it out in person.


